Filter Nasdaq and S&P 500 Stocks with Stock Screener
Discover stocks that match your strategy using a large dataset of Nasdaq and S&P 500 data. Filter by RSI(4/14), Williams %R(4/14), IV, Stochastics, MACD, and EMA20/EMA50 crossovers. The results will be visualized on an interactive TradingView chart and you may additionaly choose which indicators to display.
Comprehensive Stock Data
Analyze and filter Nasdaq and S&P 500 stocks using a rich dataset, including some of the most common key technical calculations.
Powerful Technical Filters
Screen stocks by RSI(4/14), Williams %R(4/14), IV, Stochastics, MACD, and EMA20/EMA50 crossovers.
Interactive Charting Experience
Visualize filtered stocks on a TradingView chart and choose between a set of indicators to display for deeper analysis and confident decisions.
How to use this tool for your daily trading
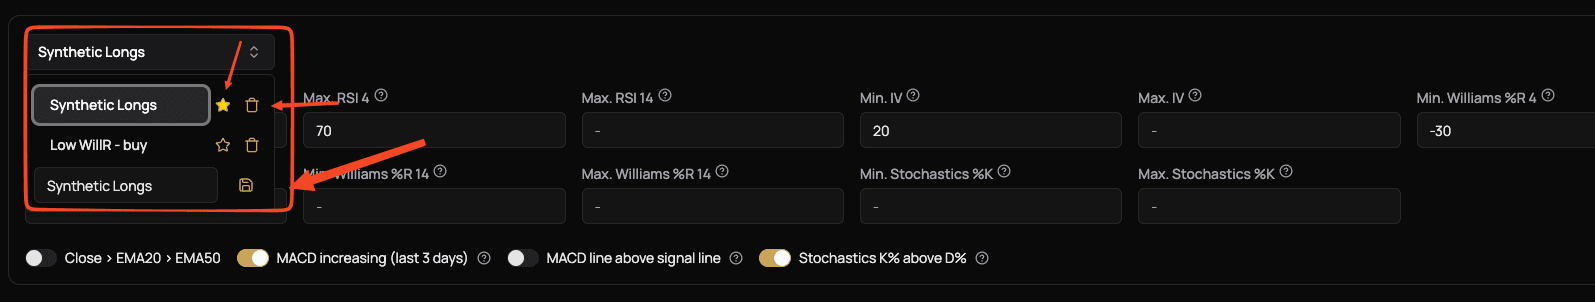
Choose your filter
Start by selecting or creating a filter preset. This lets you narrow the market down by the indicator or momentum thresholds needed for your trading strategy. You can save up to three filter presets by default. Once a filter is saved you can use it, delete it or even set one as your default.
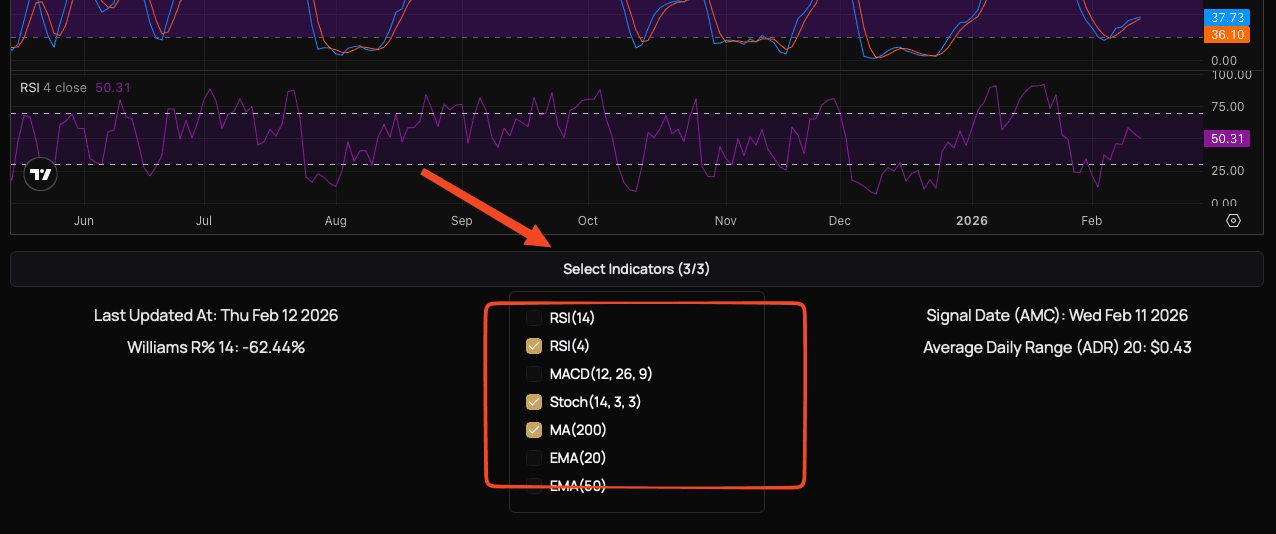
Pick indicators displayed on the chart
Add only the indicators you actually trade with like RSI, MACD, moving averages, or Stochastic to keep the chart as clean as possible.
CAVEAT: due to technical limitations you may only choose 3 indicators at the same time
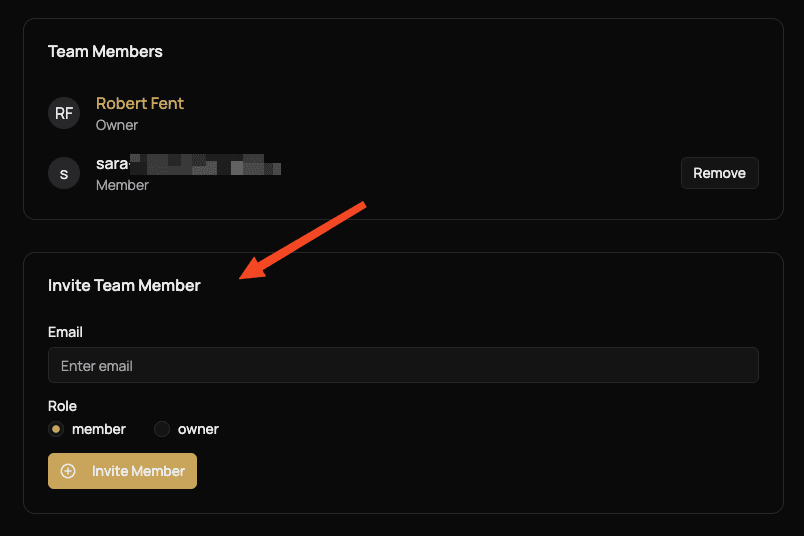
Optionally: Collaborate with your trading collegues
Being part of a team lets you share all saved filter presets. Owners can invite new members and remove non-owners, while members can simply use the shared filters.